
В R есть несколько функций для построения и стилизации дендрограмм. В данной статье рассматривается 5+ методов для построения красивых дендрограмм с помощью R.
We start by computing hierarchical clustering using the data set USArrests:
|
1 2 3 4 5 |
# Load data data(USArrests) # Compute distances and hierarchical clustering dd <- dist(scale(USArrests), method = "euclidean") hc <- hclust(dd, method = "ward.D2") |
1 plot.hclust(): R base function
As you already know, the standard R function plot.hclust() can be used to draw a dendrogram from the results of hierarchical clustering analyses (computed using hclust() function).
A simplified format is:
|
1 2 3 |
plot(x, labels = NULL, hang = 0.1, main = "Cluster dendrogram", sub = NULL, xlab = NULL, ylab = "Height", ...) |
|
1 2 |
# Default plot plot(hc) |
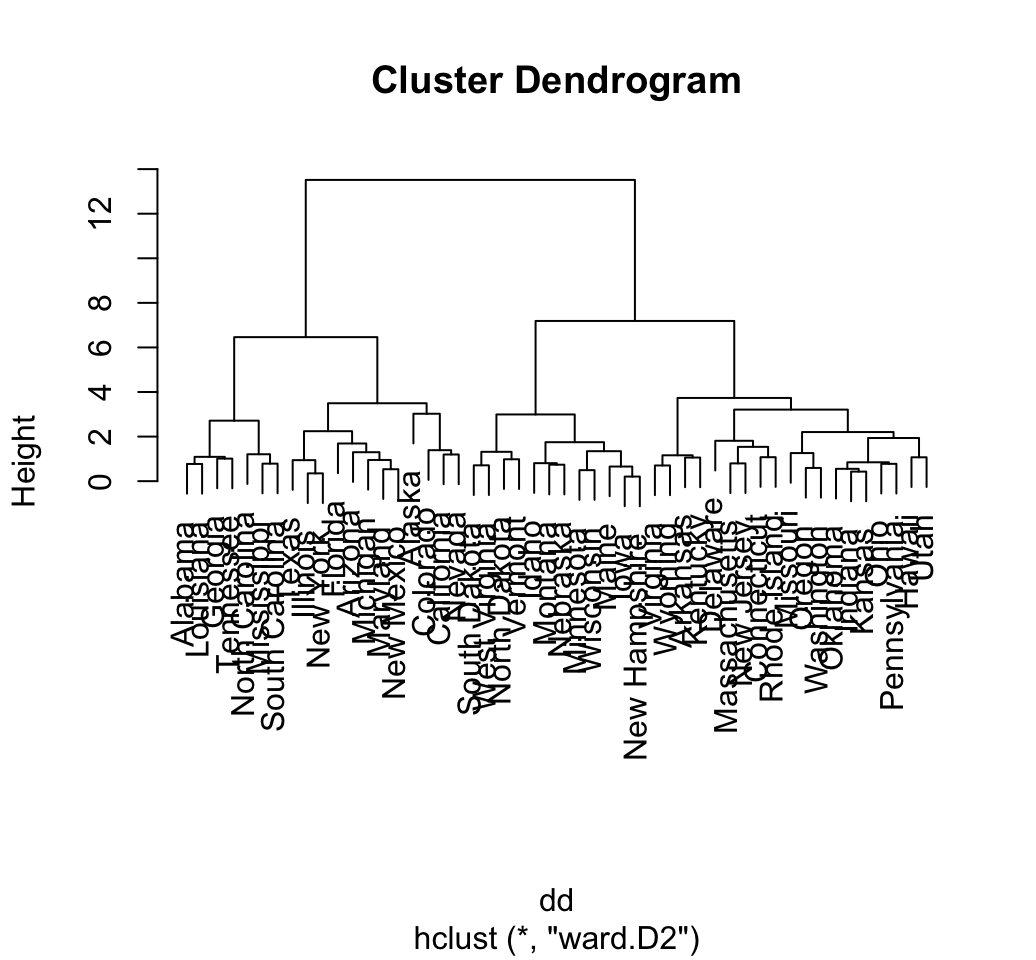
dendrogram visualization — Unsupervised Machine Learning
|
1 2 |
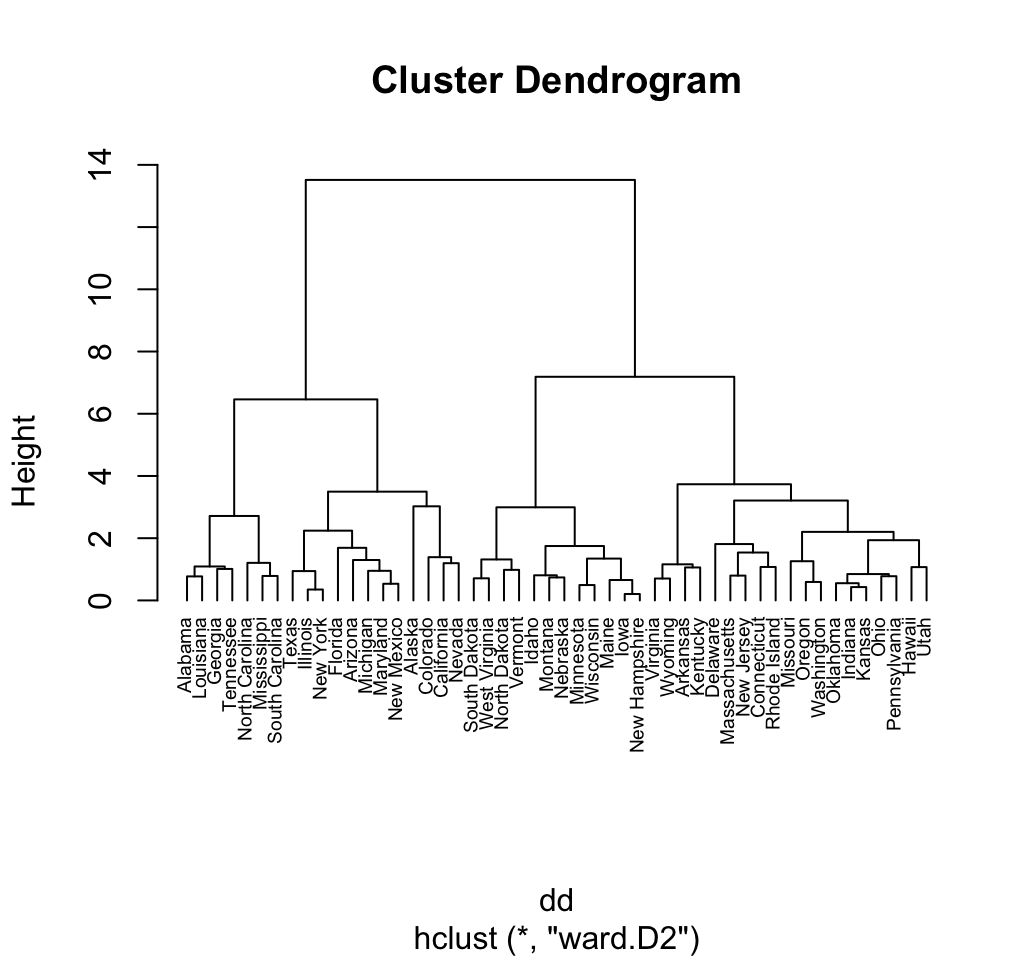
# Put the labels at the same height: hang = -1 plot(hc, hang = -1, cex = 0.6) |
Читать продолжение и другие примеры здесь.